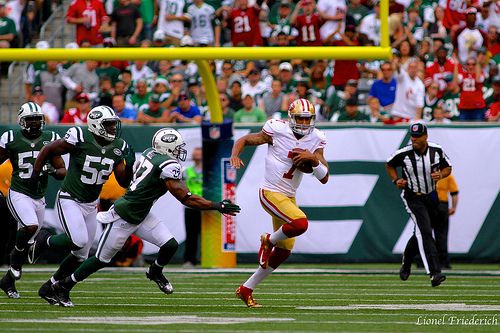
In Fantasy Football, points are important, but points relative to the position a player plays is more important. Colin Kaepernick scored 30 points last week and was the second highest second highest scorer in fantasy football, but was that performance impressive when the top twelve quarterbacks—the amount of quarterbacks played in a standard league—averaged 25 …
Player Value: A Different Way to Look at Player Performance in Week 1

In Fantasy Football, points are important, but points relative to the position a player plays is more important.
Colin Kaepernick scored 30 points last week and was the second highest second highest scorer in fantasy football, but was that performance impressive when the top twelve quarterbacks—the amount of quarterbacks played in a standard league—averaged 25 points in Week 1? Not really.
(All references to points scored in this article refer to ESPN’s standard scoring system.)
This article is meant to stimulate you as a Fantasy Football player, and get you to think more analytically about player value.
How do you calculate player value?
These are the averages for points per position for the top twelve quarterbacks, top thirty wide receivers, top thirty running backs, top twelve tight ends, top twelve kickers, and top twelve D/STs: QB (25 PTS), RB (12PTS), WR (16 PTS), TE (15 PTS), D/ST (13 PTS), and K (11 PTS).
So what do these averages tell you? Points scored at running back last week were at a premium, and points at quarterback weren’t worth much at all, unless you have Peyton Manning. If you are an experienced Fantasy Football player, this information is nothing new to you. Even if you are an experienced Fantasy player, however, do you now how to translate a player’s points scored relative to their position, and know exactly how much a player’s performance was worth? It’s ok if you don’t. The answer is down below.
To determine player value, it requires simple math. First separate players by position. Then, calculate the average and standard deviation of the points scored by the players at that position. Once you have those numbers, take a players points scored, subtract that number from the average points scored at that position, and then divide that number by the standard deviation of points for that position. Do that for every player at every position, and you have the Z-Scores for each player.
Z-Scores are informative because they compute player value based upon how far away from the average performance at a position a players performance was worth. Meaning: you know how much more valuable a running back that scored twenty points was worth, compared to a quarterback that scored twenty points.
Below is a table that has the Z-Scores for players from Week 1. The PTS column represents the amount of points a player scored in an ESPN standard scoring league. The Z-SCR column has the Z-Scores by position, and the DIFF column shows the players that moved up and down the most in the rankings when you subtract their PTS rank from their Z-SCR rank.
Week 1 Z-Scores
[table id=6 /]

This is an exercise that is more meaningful when done with larger sets of data (i.e. over the course of a 16 game season), but it is still thought provoking when done from the point totals from Week 1. For example, one cannot imagine that the tight end position will average 15 points every week of the season, as a result Jared Cook’s 24-point performance would look more impressive in any other week.
Like previously noted, this exercise is meant to make you look at player value through a new, more informative lens. A 24-point week from a player is always a positive, but now you know that those points are not worth the same at every position, and how to calculate their actual value to your team.
Devon Jordan is obsessed with statistical analysis, non-fiction literature, and electronic music. If you enjoyed reading about pitcher value in Fantasy Football, follow him on Twitter @devinjjordan.


Comments
Adam
How am I supposed to get the standard and average deviation for the players
Max Stout
While this approach has some merit it isn’t going to produce meaningful results taken by itself. As you point out the small sample size is troubling and in this case Peyton’s score is an outlier that should be excluded from the calculation or it skews the standard deviation. The real problem though is that this approach assumes that all opponents are equal and this isn’t the case. For example, was Vick really that good or was the Redskin D that bad?